In the realm of business intelligence and data analytics, reporting tools are indispensable to derive actionable insights from data. With so many options available, choosing the right one has a significant impact on an organization’s ability to make data-driven decisions.
As CIO of a manufacturing company and practitioner analyst for Acceleration Economy, I have been evaluating some of the top reporting offerings in the market. In this analysis, I’ll give my perspective on the unique capabilities and differentiators for five of these tools.

Register for Acceleration Economy’s Cloud Wars CEO Outlook 2024 Course, now available. Featuring exclusive interviews on strategy, AI, and customers with the CEOs of Cloud Wars Top 10 companies.
IBM Cognos Analytics
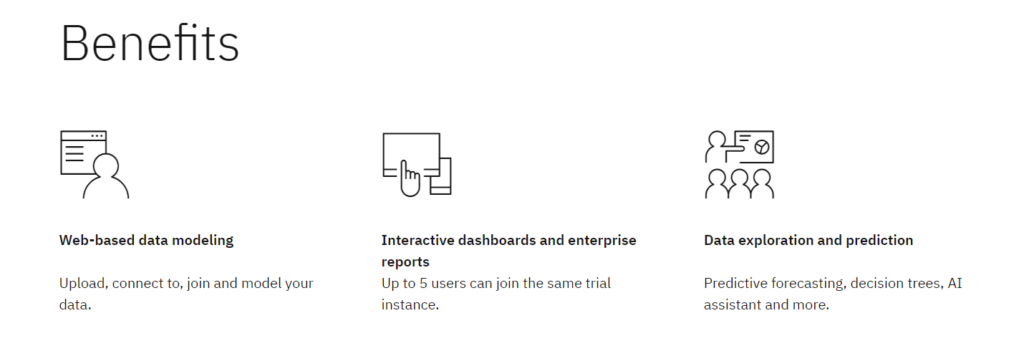
IBM Cognos Analytics is a comprehensive business intelligence (BI) tool with advanced analytics capabilities. It’s designed to support the entire analytics cycle, from data discovery to reporting and sharing insights. It stands out for its integration of artificial intelligence (AI) and machine learning (ML), which significantly enhances data exploration and automates insight generation. Cognos is particularly suited for large-scale businesses that require a scalable tool to manage complex data and reporting needs.
Void Filled: An enterprise-level BI tool that combines advanced analytics with ease of use. It caters to organizations requiring sophisticated analysis without the complexity typically associated with enterprise BI.
Differentiators:
- AI-augmented analytics: Cognos employs AI to enhance data exploration and automate the process of generating insights. This includes identifying patterns and trends in data, suggesting relevant visualizations, and even creating dashboards automatically. AI integration is pivotal for businesses looking to leverage advanced analytics without requiring extensive technical expertise.
- Comprehensive integrations: Cognos can integrate with a wide array of data sources and external applications. This makes it an ideal choice for organizations with complex IT environments.
- Scalable architecture: Designed for both mid-sized and large enterprises, it can grow with the organization. Its multi-tiered architecture can handle large volumes of data and a high number of concurrent users without compromising performance.
- Advanced data governance and security: Essential for enterprises handling sensitive information. This includes granular user access controls and data protection measures, ensuring that data integrity and security are maintained at all times.
Expected Outcomes: Large organizations gain the ability to address complex and varied analytics requirements.
Microsoft Power BI
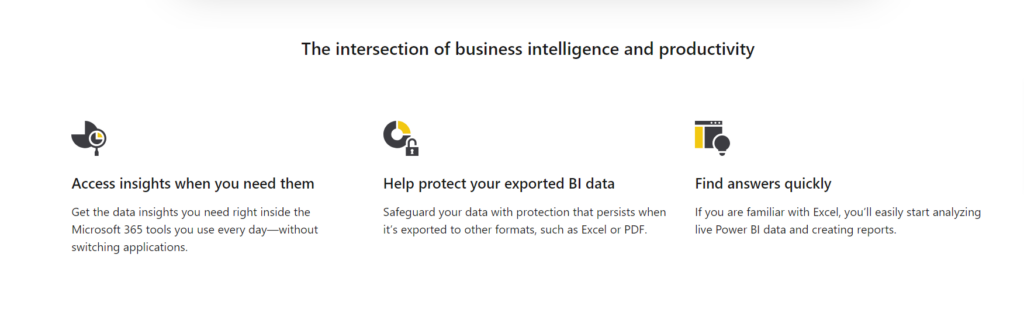
Microsoft Power BI is a business intelligence and analytics tool offering comprehensive data visualization, reporting, and insight-sharing. Seamless integration with Microsoft’s extensive suite of products, including Excel and Azure, makes it a go-to choice for many businesses, especially those already entrenched in the Microsoft ecosystem.
Void Filled: Advanced analytics and business intelligence within the reach of every business user, regardless of their technical expertise level.
Differentiators:
- Exceptional data visualization: Power BI sets a high bar with its advanced data visualization capabilities. Users can create an array of visual reports ranging from basic bar charts to complex geographical maps. These visualizations are not only aesthetically appealing but are also interactive, enabling users to delve deeper into the specifics of the data with simple clicks and drags.
- Seamless Microsoft Office integration, particularly Excel: This feature allows users to import data from Excel effortlessly, leverage existing Excel reports, and use familiar formulas within Power BI.
- AI-powered analytics: This includes features like automated insights, where the system highlights trends and patterns without manual input, and the ability to ask questions about your data in natural language, with Power BI providing answers in the form of visuals.
- User-friendly interface: Its intuitive design, guided learning paths, and drag-and-drop functionality make it easy for anyone to create and share reports, fostering a culture of data-driven decision-making across the organization.
Expected Outcomes: Adds significant value, beyond data reporting and visualization, through its advanced analytics and user-friendly design.
Qlik Cloud Analytics
Qlik is a key player in the business intelligence and data visualization market, known for its distinctive approach to data analysis. It employs an associative data model that gives users a comprehensive view of data relationships. Qlik Cloud Analytics enables in-depth insights and discovery, making it particularly powerful for complex analysis. Its emphasis on user-driven data exploration and interactive reporting makes it a favorite among businesses that prioritize data discovery and informed decision-making.
Void Filled: Unlike traditional BI tools that follow a linear and query-based data exploration model, Qlik Cloud Analytics’ associative engine allows users to probe all possible connections between data points. This provides a more exploratory and intuitive experience that can uncover hidden trends and patterns not visible through standard analysis methods.
Differentiators:
- Associative data modeling: This approach enables the discovery of hidden insights and relationships within the data, providing a richer analytical experience.
- In-memory data processing: This feature means that even with large datasets, Qlik Cloud Analytics can deliver quick and efficient data processing, enabling real-time data exploration.
- Customizable dashboards and reports: Users can tailor the interface and visualizations to meet their specific business needs, which is particularly useful for organizations that require bespoke reporting tools.
- Intuitive design for all user levels: Designed to cater to both technical and non-technical users, Qlik Cloud Analytics’ intuitive user interface ensures that everyone in the organization can engage with and benefit from data analytics. Inclusivity is key to fostering a data-driven culture.
Expected Outcomes: Gain deeper insights from data and get a fresh perspective on data analytics.
Oracle Analytics Cloud
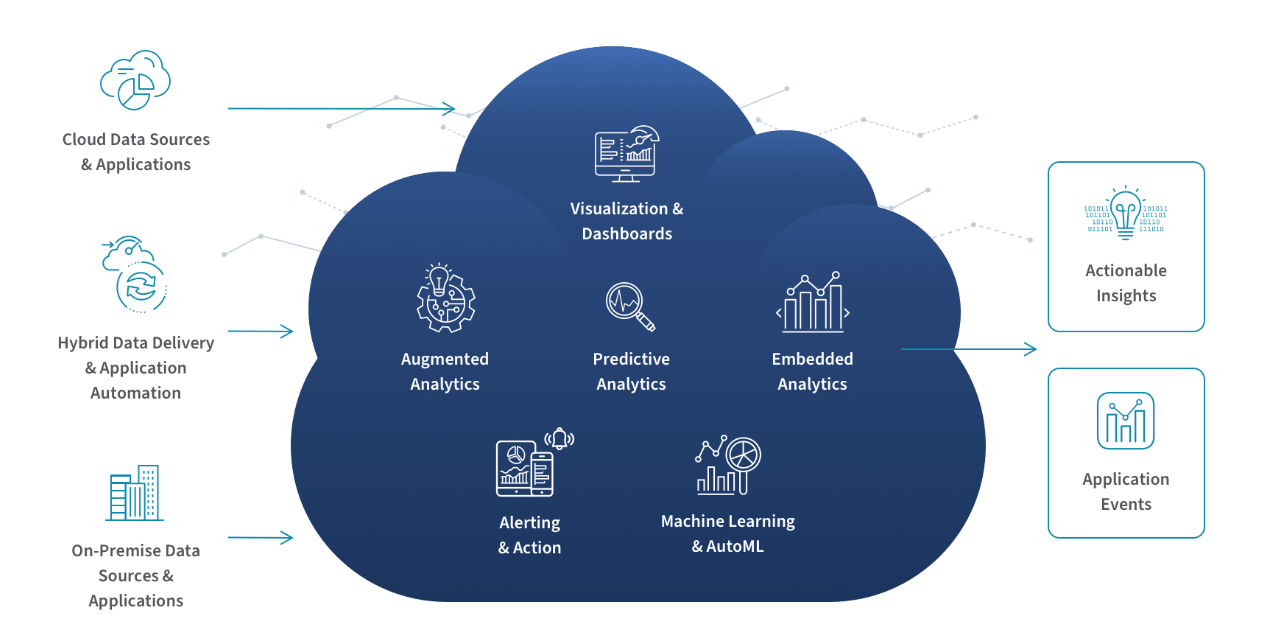
Oracle Analytics Cloud (OAC) is a cloud-based analytics platform with a full suite of tools for data preparation, visualization, and enterprise reporting. Integrating cutting-edge AI and ML, OAC stands out for its advanced analytics capabilities.
Void Filled: A holistic, integrated analytics platform in the cloud. It combines self-service data visualization with enterprise-grade reporting and analytics, all within a single, unified platform. This eliminates the need for disparate tools and brings a comprehensive analytics capability to businesses, ensuring that both individual analysts and large departments can effectively leverage data insights.
Differentiators:
- Comprehensive suite of tools: Includes advanced data visualization, robust reporting, and ML-driven analytics. It enables users to handle various aspects of data analysis, from initial data preparation to sharing insights.
- Cloud-native features for scalability and flexibility: This allows organizations to easily scale their analytics capabilities up or down based on their evolving needs.
- Advanced analytics with AI and ML: This includes capabilities for automated insights, predictive analytics, and anomaly detection, enabling users to uncover deeper insights and make more informed decisions.
- Strong data governance and security: As with other Oracle products, OAC places a strong emphasis on data governance and security. This is crucial for organizations that deal with sensitive data and require strict compliance with data privacy regulations.
Expected Outcomes: Organizations leverage the scalability and flexibility of the cloud while maintaining high standards of data governance and security.
Salesforce Tableau
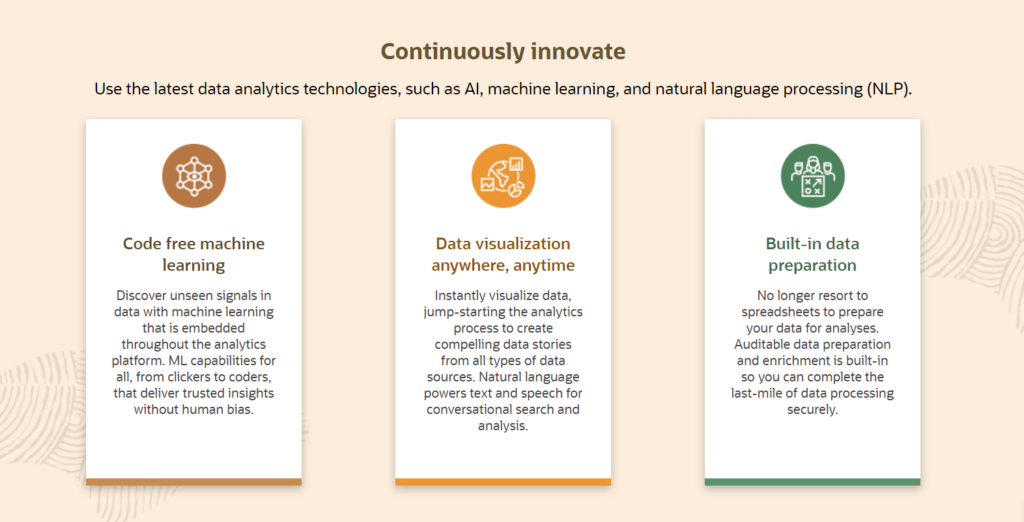
Tableau, acquired by Salesforce in 2019, has emerged as a leader in the field of data visualization and analytics, distinguishing by an intuitive, interactive interface. Renowned for its ability to handle voluminous datasets with remarkable ease and efficiency, Tableau empowers users to explore and visualize data in a manner that is both insightful and aesthetically compelling. The platform is designed to cater to a diverse user base, from data analysts to non-technical business users, enabling them to derive meaningful insights from data through powerful visual storytelling.
Void Filled: Simplifies complex data analysis, empowering users to transform raw data into easy-to-understand visual formats, thereby making data analysis accessible to a broader audience.
Differentiators:
- Advanced data visualization: Offers a wide range of visualization options, from standard charts and graphs to complex interactive dashboards. Users can create custom visualizations that are not only visually striking but also provide deep insights into the data.
- Handling large datasets with speed: This efficiency is pivotal for businesses dealing with big data, enabling them to generate reports and insights without significant delays.
- Mobile support and responsive design: The product’s responsive design ensures that reports and dashboards are accessible and functional across various devices, enhancing the flexibility and reach of data insights.
- Extensive community and resource library: This community-driven approach provides users with a wealth of learning materials, templates, and forums for discussion, making it easier to find solutions and inspiration for data visualization challenges.
Expected Outcomes: Gain deeper insights from the organization’s data, while tapping into strong community support, and the ability to leverage the power of data visualization and analytics.


Ask Cloud Wars AI Agent about this analysis