Find out what is affecting system performance.
Search Results: data (5336)
This session will help you begin the process of moving to Power BI to collect data and present it in a professional dashboard style of reporting. Tie into your system data sources and avoid the manual input requirements that can lead to errors and inconsistencies allowing you to spend your time analyzing your data and less time compiling data.
As the pace of business accelerates, organizations have to drive efforts to keep up with the times. For businesses using…
Microsoft has made both the List View and Card view incredibly powerful – all we need to do is learn a little bit more to use these capabilities. Learn how to organize your Lists for maximum efficiency. Start using only exactly the data you need in Factboxes. Remove visual static from Cards by fine-tuning your FastTabs. Attending this session will make your navigation in Lists and Cards lightning-quick and easy!
Finance leaders understand the importance of creating efficient processes and scalable solutions, especially as we head into a new year where remote or hybrid work environments are expected to be the norm. But if tedious day-to-day tasks or a lack of data and insights are hindering your strategic pursuits, “going digital” could be the perfect solution.
Avalara AvaTax provides cloud-based sales and use tax calculation with comprehensive, up-to-date tax rates pushed to your shopping cart or invoicing system, automatically.
By Alan Wyne, Aug 27, 2020If you have been in the Microsoft Dynamics community long, then you no doubt have…
By Dan Doolin, Jun 02, 2020Reduced hours, layoffs, and even termination is wreaking havoc on US workers due to the…
By Dan Doolin, Jun 11, 2020Expanded Family and Medical Leave Act (E-FMLA) SimplifiedThe Families First Coronavirus Response Act (FFCRA) consists…
How to manage the financial cutover from a legacy system.
Ready to create your own Dynamics paradise? This second session in our two-part series is not a mirage! Join us on a journey to explore methods for managing data and the advantages of each, survey automated processes and their uses, discuss Workflow options and even take the first steps for creating one, and work with Solutions to move customizations between environments. You’re now on the path to becoming a master administrator.
By Marlene Mankin, Apr 6, 2020Notifications … What are they? And how can they be utilized in Business Central/NAV?In this…
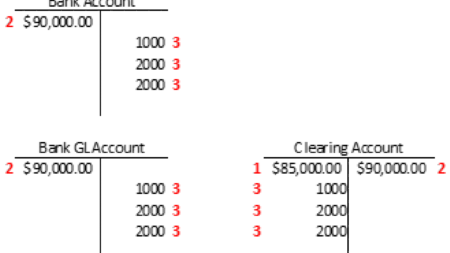
A how-to for migrating bank balances.
A very interesting dashboard was presented on a user activity on twitter. The user, Adewale Yusuf, explained his activity using the PowerBi dashboard.
By Marlene Mankin, May 8, 2020When it comes time to make a new budget, are you thrilled? Or perhaps feeling…
Data Analytics is all the Rage. Learn how to use a tool you are already using to create up to the second refreshable Excel reports using your GP Data. We’ll discuss dashboarding, data-sources and how to make the most of Excel and GP!
By Marlene Mankin, May 22, 2020It can be highly frustrating to encounter RapidStart errors and not know what to do…
Faster than a speeding bullet…more powerful than a locomotive…come join Amber Bell (Training Dynamo) in this fast-paced GP Tips session that will turn you from a GP User into a GP Superhero! Learning Objectives: Have X-Ray Vision into Company Data using SmartList Designer/Builder’s Publish to Excel functionality! Prevent Data Annihilation using Field Level Security! Move through GP ‘Faster Than a Speeding Bullet’ with a new way to create Macros!
Automate targeted marketing campaigns and more using your Microsoft Dynamics data. Check out our listing on AppSource and get started with the emfluence Marketing Platform for Microsoft Dynamics today.
An overview of how to filter and sort on the Dynamics 365 Finance menus.


