
In the last few years, since Power BI was released (July 25th, 2015), we are all witnessing a very interesting debate among the data analyst communities: ‘Excel or Power BI?’, ‘which one is the best tool for data analysis?’… and things of this nature.
Sometimes this debate has crossed the line among certain communities and became like a war, as each community is trying to defend its position and of course its passion. Yes, data analyst communities are very passionate about what we do and how we do it.
The intention of this blog is not about comparing tools, rather provide another perspective. As such, this is not about the tool; it is about the needs. Yes, the needs. What is your need in terms of data ingestion, data size, data aggregation, data analysis, and distribution of the information?
Let’s start from the beginning, what is Excel and what is Power BI, and what’s their main purpose as a tool.
About Excel
According to Microsoft, Excel is a spreadsheet developed by Microsoft for Windows, macOS, Android, and iOS. It features calculation, graphing tools, pivot tables, and a macro programming language called Visual Basic for Applications (VBA). It replaced Lotus 1-2-3 as the industry standard for spreadsheets. It was first released in 1987.
Hang on a second… what is a ‘spreadsheet’?
According to Wikipedia, a spreadsheet is a computer application for the organization, analysis, and storage of data in tabular form. Spreadsheets were developed as computerized analogs of paper accounting worksheets. The program operates on data entered in cells of a table. Each cell may contain either numeric or text data, or the results of formulas that automatically calculate and display a value based on the contents of other cells.
Spreadsheet users can adjust any stored value and observe the effects on calculated values. This makes spreadsheets useful for ‘what-if’ analysis since many cases can be rapidly investigated without manual recalculation.
About Power BI
According to Microsoft, Power BI is a collection of software services, apps, and connectors that work together to turn your unrelated sources of data into coherent, visually immersive, and interactive insights. Your data may be an Excel spreadsheet or a collection of cloud-based and on-premises hybrid data warehouses. Power BI lets you easily connect to your data sources, visualize and discover what’s important, and share that with anyone or everyone you want.
Power BI was conceived and designed by SQL Server Reporting Services Team at Microsoft’ (Thierry D’Hers and Amir Netz). This is important because Power BI is a database-engine tool, it is not a spreadsheet-like tool.
Analyzing the needs
In terms of data ingestion and data size, as perhaps the absolute first question that every single analyst must make is ‘where is my data, and how big is that?’ In other words, is data to be analyzed stored in a data base (or multiple databases); or an application (or multiple applications); or is my data manually generated by somebody (or multiple people)? Even, is my data in all those places at the same time?
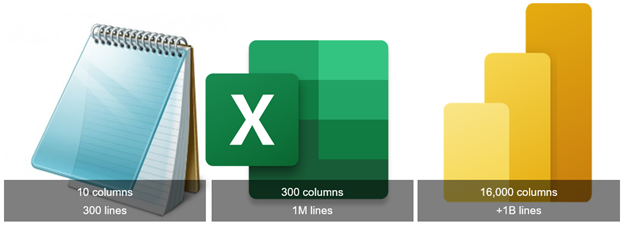
If data can be extracted for just one or two different sources, and it is less than 500,000 lines, perhaps Excel is a good option to make an analysis.
If data needs to be extracted from multiple sources and it is bigger than 500,000 lines, perhaps Power BI is the better choice.
If we think about data aggregation, we think about how we have to stage and prepare the data that we have to analyze. In other words, shall I have to do a very granular low-level analysis, data point by data point? Do I have to make an analysis based on column-by-column based?
If the need here is to make custom granular low-level analysis and calculation by data point, excel is the tool.
However, if we must aggregate data that has been already staged and prepared to be aggregated, Power BI is the right tool
Regarding data analysis, both tools are very powerful. However, let’s focus on the need again. Do I need to make an analysis on very specific granular data? Or shall I need larger amounts of data, after being aggregated?
If the need is focused on the low-level granular data, Excel is the tool. However, if you need to analyze a large amount of data, Power BI is better designed for that job.
When we think about the distribution of information, we mean how the analysis that we have made will be shared with customers and stakeholders. And this need is very important.
An analysis is made for us to gain knowledge about our raw data, but also to share that knowledge with others. Therefore, it is very important that all the analysis that we do are developed in a way that others can gain knowledge of such raw data, obtain insights and eventually, take informed actions and decisions accordingly.
Excel is not an enterprise tool; it is an individual data analysis tool. Therefore, if a business analyst uses Excel to analyze data, its only option to communicate or distribute information with others is just sharing the Excel file itself.
Power BI, in contrast, is an enterprise-level tool. So, the distribution of information happens from a Web-app where data consumers access and view all the analysis made. No physical sharing of the Power BI file is needed.
Last, but not least
Consider the resource needs too. If the need to create recurrent reporting. Developing recurrent reporting and analysis with Excel means continuous antagonism cycles of development effort and business value: develop-analyze-develop-analyze. However, Power BI has a very different paradigm: develop once, analyze always.
Consider all the time and human resources needed to develop organizational reporting, and adapt the tools to the needs, and not the other way around.

More DAC Content by Pablo Moreno
How to Interview a Data Scientist
Roadmap to Digital Transformation
Follow Pablo Moreno’s DAC Profile HERE


