
Power BI is a very well-known data analysis and visualization tool, and it’s a great solution for business intelligence in general. It has a sophisticated ability to analyze data using Power Query and create collections of front-end visualizations, but it does not contain a function library for data science, statistics, NLP, and other areas.
Bypassing Power Query with R and Python allows you and your organization a deeper analysis than the out-of-the-box Power BI product. The main differentiator between R and Python is in their approach to data science; R is mainly used for statistical analysis, Python provides a more general approach to data wrangling. However, both are open source programming languages supported by extensive libraries, tools, and user communities. As a result, they can extend Power BI’s innate language abilities to handle varieties of file types and data sources and create even better graphical data representations.
The Power BI Query Editor supports R and Python scripts to transform data. Understanding this process is helpful if your organization has knowledgeable R or Python experts and you’re looking to simplify organization-wide ‘need to know” skill sets. Also, it deters uprooting your existing business solutions in R or Python languages.
In this blog, we will illustrate how to produce a machine learning model, specifically from R into Power BI, and we will do it from scratch. This is an excellent intermediate-level reference tool for training yourself and others at your organization.
Transforming Data in Power BI with R Scripts
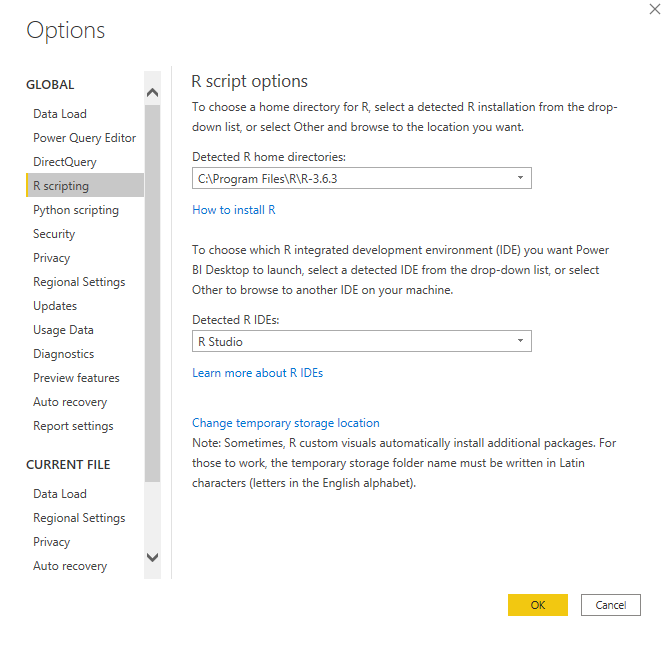
Before we start, let’s make sure that R is installed in our local system and correctly set up into Power BI.
To do so, check on Options and Settings > Options > R scripting and make sure that Power BI -desktop- has detected the root directory where R is installed, as well as RStudio (in case you are using that IDE).
To train a model, let’s use a sample dataset that is already available in R, called ‘sonar’. It is a dataset that contains 208 observations (lines) and 61 variables (columns).
There are 60 columns titled from V1 through V60, all with numeric data, and one column named ‘Class’ with two categories: ‘M’ and ‘R’.
Let’s create a random forest model capable to predict if the variable ‘Class’ is either ‘M’ or ‘R’, given certain values of the 60 independent variables, from V1 through V60.
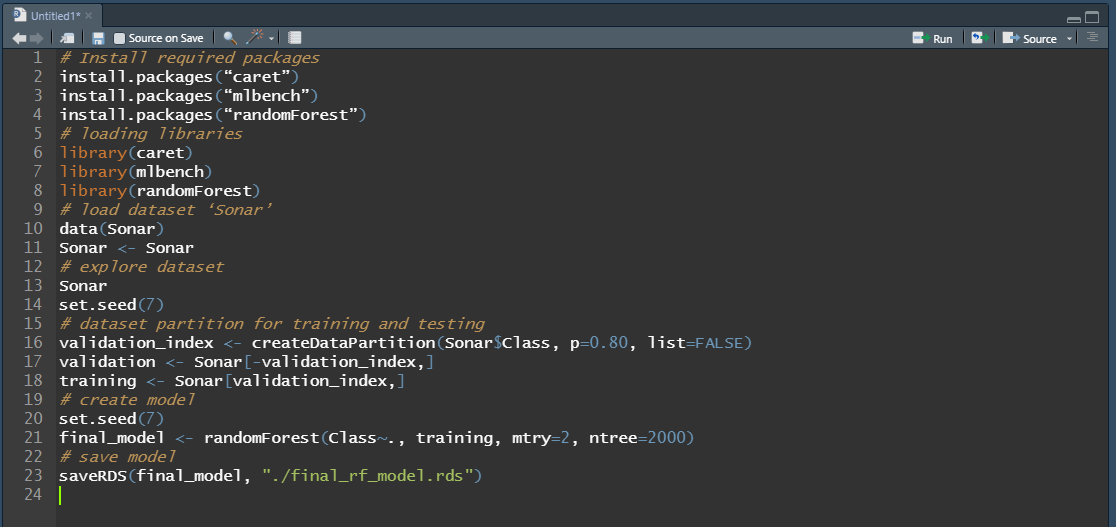
So, we run the following code in RStudio
# Install required packages
install.packages(“caret”)
install.packages(“mlbench”)
install.packages(“randomForest”)
# loading libraries
library(caret)
library(mlbench)
library(randomForest)
# load dataset ‘Sonar’
data(Sonar) Sonar <- Sonar
# explore dataset
Sonar
set.seed(7)
# dataset partition for training and testing
validation_index <- createDataPartition(Sonar$Class, p=0.80, list=FALSE)
validation <- Sonar[-validation_index,]
training <- Sonar[validation_index,]
# create model
set.seed(7)
final_model <- randomForest(Class~., training, mtry=2, ntree=2000)
# save model
saveRDS(final_model, “./final_rf_model.rds”)
Once all this code has been successfully executed in R, a new file at the local system is created, which contains the trained model; a file called ‘final_rf_model.rds’
At this point, the model has been trained with all the features and it is ready to receive new data.
To do so, we need to load into Power BI 2 things: a dataset (with the same structure of the dataset that was used to train the model; and the model.
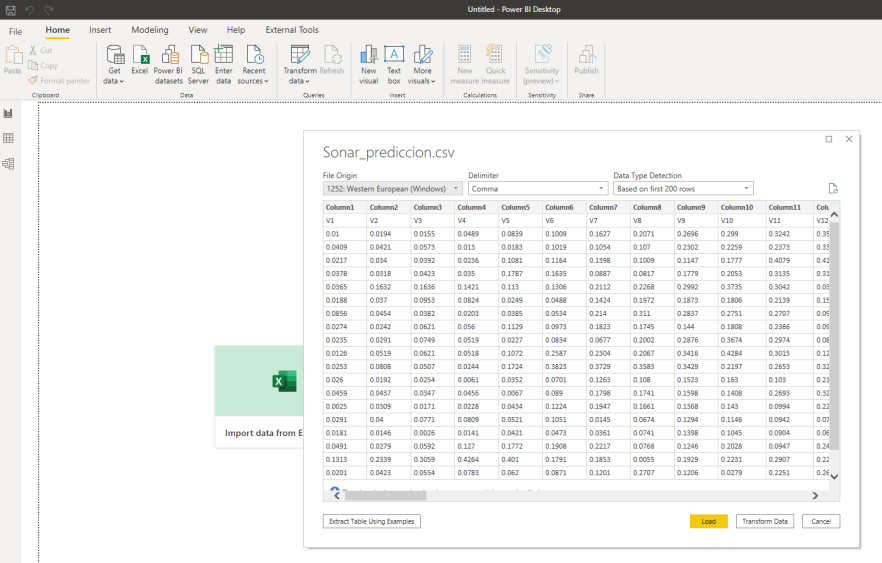
In this example, we created an artificial dataset with 60 columns and 50 lines. 60 columns named from V1 through V60, with the same data type used at the training dataset (numeric). We don’t need the column ‘Class’ as this is the one that we want to predict. This dataset was saved as ‘csv’ file and loaded into Power BI.
It can work perfectly with another data source, as long as the structure remains the same as the training dataset.
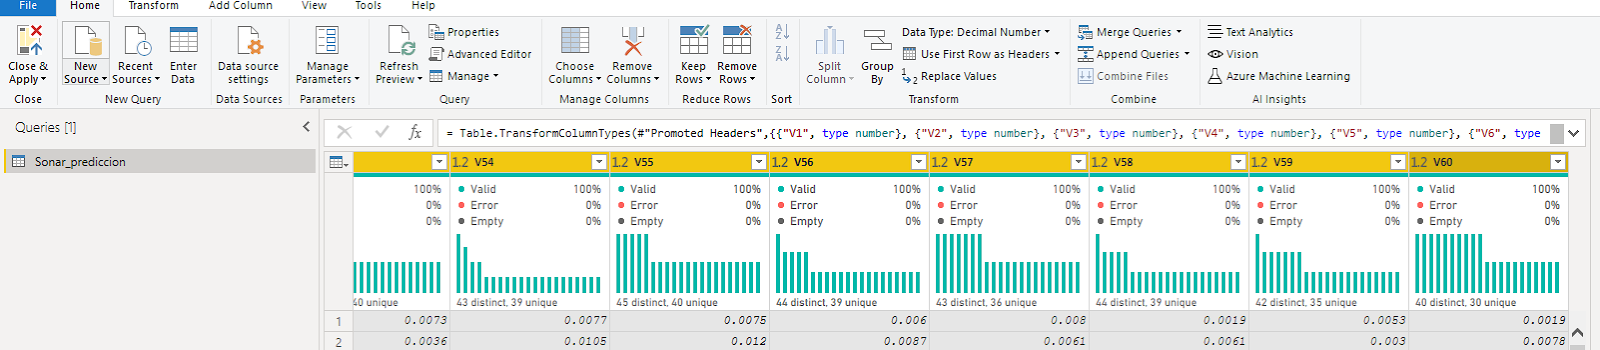
Once the dataset is loaded, let’s go to Power query and make sure that all data types for all columns are correct
At this point, we can now load the predictive model by opening the R script in Power Query
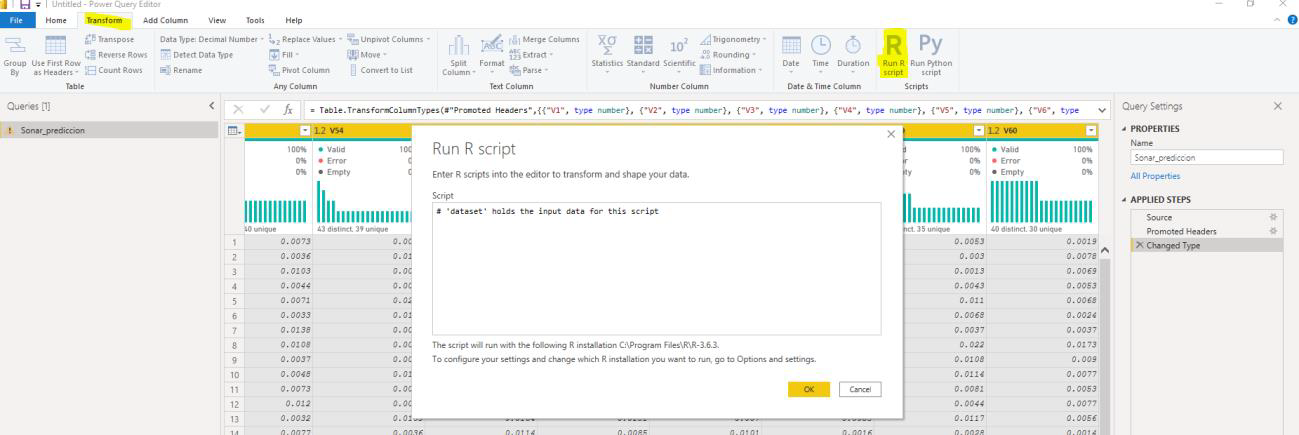
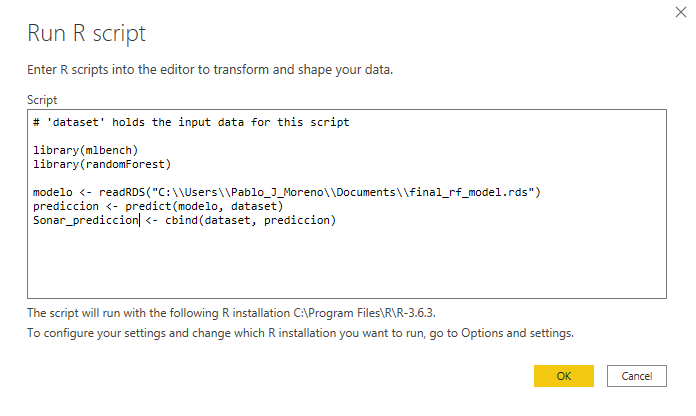
Where we insert the following code:
library(mlbench)
library(randomForest)
model <- readRDS(“C:\Users\Pablo_J_Moreno\Documents\final_rf_model.rds”)
prediction <- predict(modelo, dataset)
Sonar_prediction <- cbind(dataset, prediction)
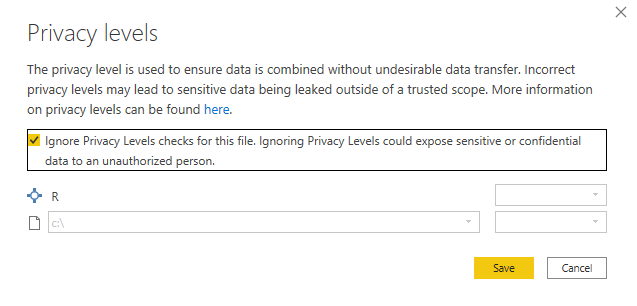
After clicking ‘OK’, Power Query will ask for privacy levels associated to the dataset, which we ignore
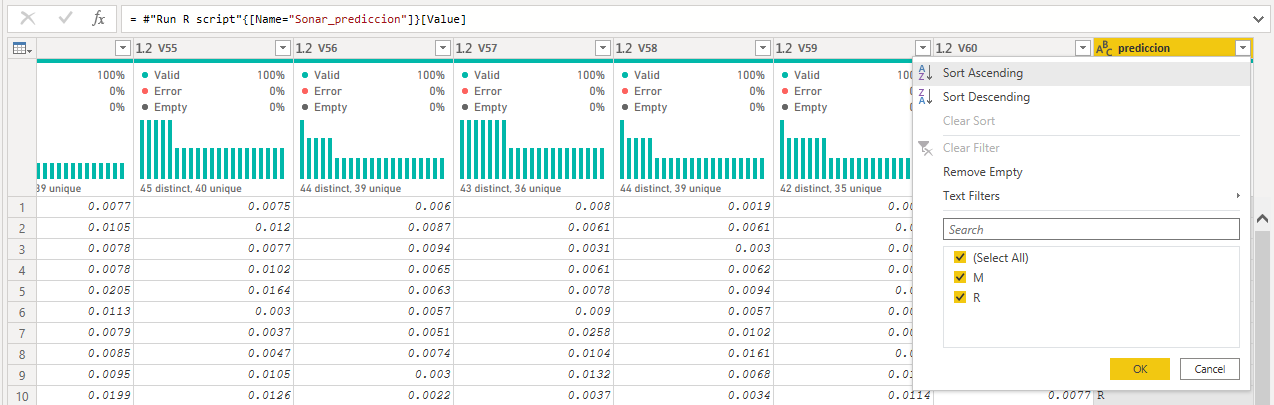
Once the model has been loaded and made its prediction, it generates a table (data frame) with the extra columns with the result of the prediction.
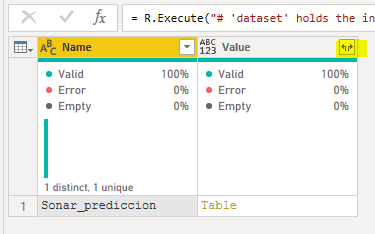
So, we can see the new column called ‘prediction’ in our dataset, indicating which line is either ‘M’ or ‘R’
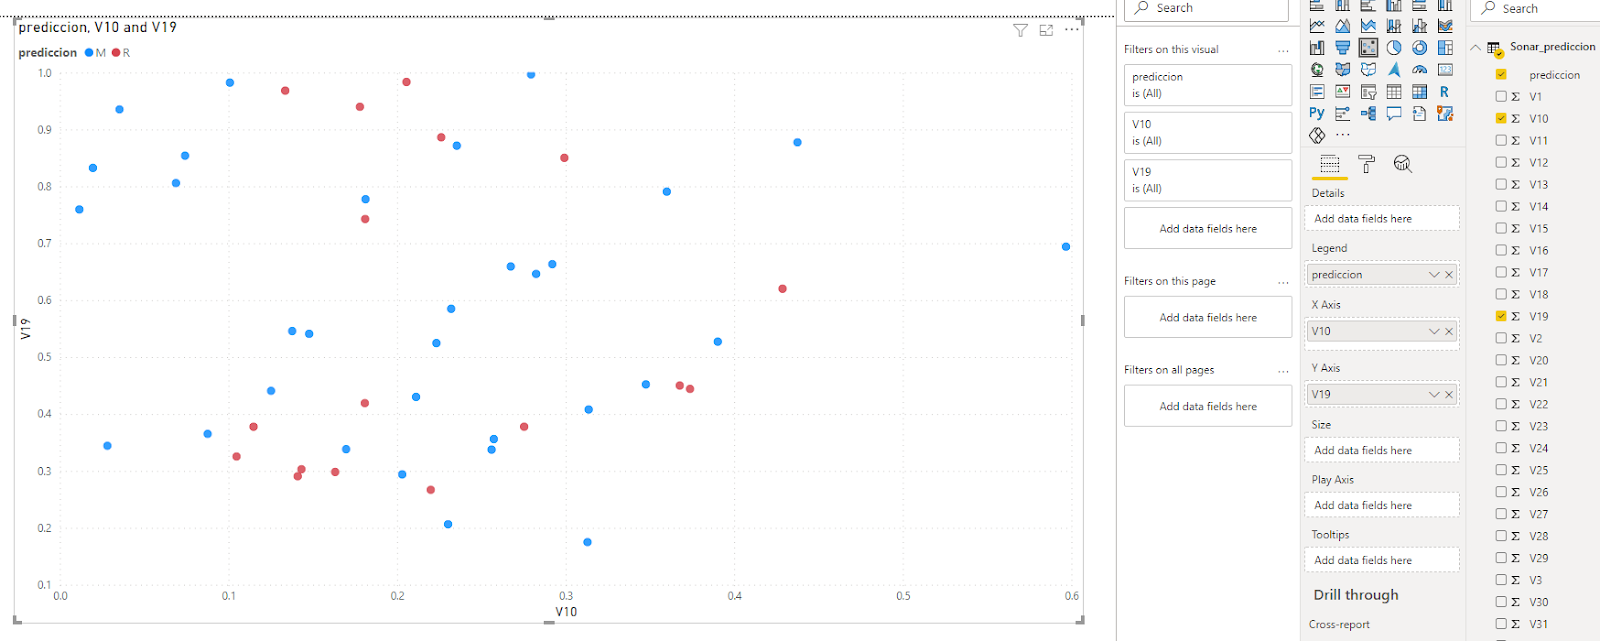
After closing and saving, let’s do a simple visualization, now using the ‘prediction’ column
In this example, we have used a static csv file, but this application also works with another type of sources like a database or web base data, as long as the source is formatted appropriately and it has the same structure as the original training dataset.
This Power BI report can be published to Power BI Service and it will work perfectly making predictions with new data, just make sure that your gateway is ‘on personal’ mode, as it does not work ‘on enterprise’ mode.
This piece covered how to use R language in Power BI easily and efficiently to transform your data. For other helpful tutorials like this as well as deeper thought leadership and insights, please explore my other work!
More DAC Content by Pablo Moreno
How to Interview a Data Scientist
Roadmap to Digital Transformation
Excel or Power BI? … It’s Not About the Tool
Follow Pablo Moreno’s DAC Profile HERE


